
Page 94 - IMDR JOURNAL 2023-24
P. 94
IMDR’s Journal of Management Development & Research 2023-24
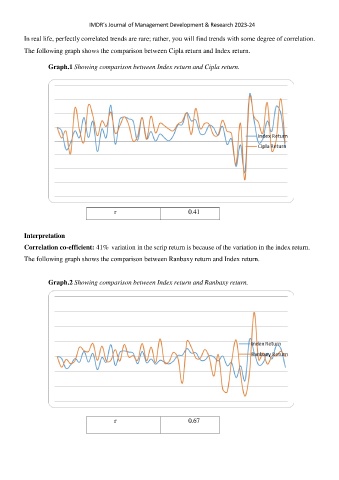
In real life, perfectly correlated trends are rare; rather, you will find trends with some degree of correlation.
The following graph shows the comparison between Cipla return and Index return.
Graph.1 Showing comparison between Index return and Cipla return.
r 0.41
Interpretation
Correlation co-efficient: 41% variation in the scrip return is because of the variation in the index return.
The following graph shows the comparison between Ranbaxy return and Index return.
Graph.2 Showing comparison between Index return and Ranbaxy return.
r 0.67