
Page 106 - IMDR JOURNAL 2023-24
P. 106
IMDR’s Journal of Management Development & Research 2023-24
This plot was used to check linearity and homoscedasticity in the model. Red line in the graph must be
straight line as per linear model points must be scatter around the line without showing any pattern. In
the above graph the condition of homoscedasticity was present meaning the error term did not vary much
as the value of the independent variable changes. In terms of linearity, we could say the red line was
straight line in parts and not a continuous straight line. Because of this our R-square value was less
suggesting model cannot be used for prediction purpose.
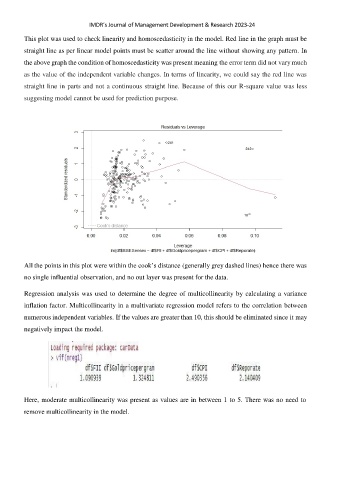
All the points in this plot were within the cook’s distance (generally grey dashed lines) hence there was
no single influential observation, and no out layer was present for the data.
Regression analysis was used to determine the degree of multicollinearity by calculating a variance
inflation factor. Multicollinearity in a multivariate regression model refers to the correlation between
numerous independent variables. If the values are greater than 10, this should be eliminated since it may
negatively impact the model.
Here, moderate multicollinearity was present as values are in between 1 to 5. There was no need to
remove multicollinearity in the model.