Page 264 - IMDR JOURNAL 2023-24
P. 264

IMDR’s Journal of Management Development & Research 2023-24


               Gift Nifty derives from the price of the Nifty spot. We can say that the sentiment of Gift

               Nifty determines the sentiment of the spot index. In the table, we observe that the openings
               differ 17 times out of the 32 entries, which is 54 percent of the total. The RSI also remains

               the same for both indices. The RSI price is going hand in hand. It is seen that when the Gift
               Nifty and Nifty both cross the overbought levels of 70, they immediately consolidate or fall.

               So, if risk is taken one can initiate a trade using this strategy.
               When compared we can see that the size and body of candles of both the indices are changing

               and varying.  As the Gift Nifty is trading longer hours the gaps that are seen in the Nifty chart

               are not seen in the Gift Nifty chart. As Nifty 50 spot opens at the trading price of the Gift
               Nifty.

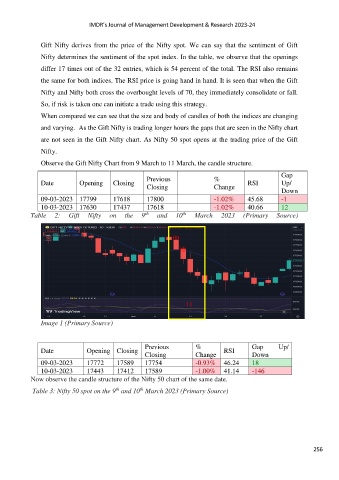
               Observe the Gift Nifty Chart from 9 March to 11 March, the candle structure.

                                                                                                    Gap
                                                     Previous               %
               Date          Opening   Closing                                          RSI         Up/
                                                     Closing                Change
                                                                                                    Down
               09-03-2023  17799         17618       17800                  -1.02%      45.68       -1
               10-03-2023  17630         17437       17618                  -1.02%      40.66       12
                                                    th
                                                                 th
            Table  2:  Gift  Nifty  on  the  9   and  10   March  2023  (Primary  Source)

                                                              09

                                                                10


                                                                  11


               Image 1 (Primary Source)


                                                    Previous          %                   Gap      Up/
               Date             Opening   Closing                               RSI
                                                    Closing           Change              Down
               09-03-2023       17772     17589     17754             -0.93%  46.24       18
               10-03-2023       17443     17412     17589             -1.00%  41.14       -146
            Now observe the candle structure of the Nifty 50 chart of the same date.

                                                  th
                                          th
             Table 3: Nifty 50 spot on the 9  and 10  March 2023 (Primary Source)


                                                                                                               256
   259   260   261   262   263   264   265   266   267   268   269