
Page 267 - IMDR JOURNAL 2023-24
P. 267
IMDR’s Journal of Management Development & Research 2023-24
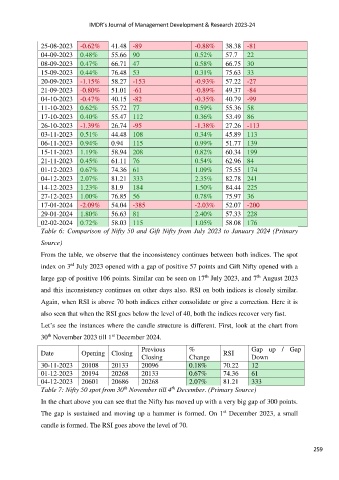
25-08-2023 -0.62% 41.48 -89 -0.88% 38.38 -81
04-09-2023 0.48% 55.66 90 0.52% 57.7 22
08-09-2023 0.47% 66.71 47 0.58% 66.75 30
15-09-2023 0.44% 76.48 53 0.31% 75.63 33
20-09-2023 -1.15% 58.27 -153 -0.93% 57.22 -27
21-09-2023 -0.80% 51.01 -61 -0.89% 49.37 -84
04-10-2023 -0.47% 40.15 -82 -0.35% 40.79 -99
11-10-2023 0.62% 55.72 77 0.59% 55.36 58
17-10-2023 0.40% 55.47 112 0.36% 53.49 86
26-10-2023 -1.39% 26.74 -95 -1.38% 27.26 -113
03-11-2023 0.51% 44.48 108 0.34% 45.89 113
06-11-2023 0.94% 0.94 115 0.99% 51.77 139
15-11-2023 1.19% 58.94 208 0.82% 60.34 199
21-11-2023 0.45% 61.11 76 0.54% 62.96 84
01-12-2023 0.67% 74.36 61 1.09% 75.55 174
04-12-2023 2.07% 81.21 333 2.35% 82.78 241
14-12-2023 1.23% 81.9 184 1.50% 84.44 225
27-12-2023 1.00% 76.85 56 0.78% 75.97 36
17-01-2024 -2.09% 54.04 -385 -2.03% 52.07 -200
29-01-2024 1.80% 56.63 81 2.40% 57.33 228
02-02-2024 0.72% 58.03 115 1.05% 58.08 176
Table 6: Comparison of Nifty 50 and Gift Nifty from July 2023 to January 2024 (Primary
Source)
From the table, we observe that the inconsistency continues between both indices. The spot
rd
index on 3 July 2023 opened with a gap of positive 57 points and Gift Nifty opened with a
th
th
large gap of positive 106 points. Similar can be seen on 17 July 2023, and 7 August 2023
and this inconsistency continues on other days also. RSI on both indices is closely similar.
Again, when RSI is above 70 both indices either consolidate or give a correction. Here it is
also seen that when the RSI goes below the level of 40, both the indices recover very fast.
Let’s see the instances where the candle structure is different. First, look at the chart from
th
st
30 November 2023 till 1 December 2024.
Previous % Gap up / Gap
Date Opening Closing RSI
Closing Change Down
30-11-2023 20108 20133 20096 0.18% 70.22 12
01-12-2023 20194 20268 20133 0.67% 74.36 61
04-12-2023 20601 20686 20268 2.07% 81.21 333
th
th
Table 7: Nifty 50 spot from 30 November till 4 December. (Primary Source)
In the chart above you can see that the Nifty has moved up with a very big gap of 300 points.
st
The gap is sustained and moving up a hammer is formed. On 1 December 2023, a small
candle is formed. The RSI goes above the level of 70.
259