
Page 86 - IMDR Journal 2025
P. 86
Research Article
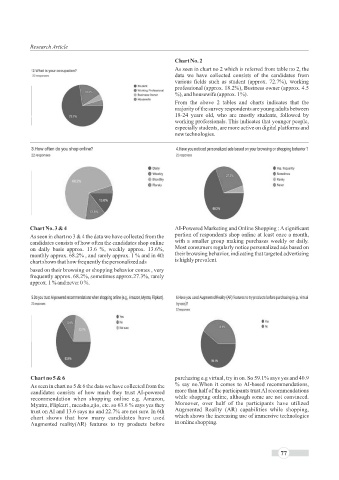
Chart No. 2
As seen in chart no 2 which is referred from table no 2, the
data we have collected consists of the candidates from
various fields such as student (approx. 72.7%), working
professional (approx. 18.2%), Business owner (approx. 4.5
%), and housewife (approx. 1%).
From the above 2 tables and charts indicates that the
majority of the survey respondents are young adults between
18-24 years old, who are mostly students, followed by
working professionals. This indicates that younger people,
especially students, are more active on digital platforms and
new technologies.
Chart No. 3 & 4 AI-Powered Marketing and Online Shopping : A significant
As seen in chart no 3 & 4 the data we have collected from the portion of respondents shop online at least once a month,
candidates consists of how often the candidates shop online with a smaller group making purchases weekly or daily.
on daily basis approx. 13.6 %, weekly approx. 13.6%, Most consumers regularly notice personalized ads based on
monthly approx. 68.2% , and rarely approx. 1 % and in 4th their browsing behavior, indicating that targeted advertising
chart shows that how frequently the personalized ads is highly prevalent.
based on their browsing or shopping behavior comes , very
frequently approx. 68.2%, sometimes approx.27.3%, rarely
approx. 1 % and never 0 %.
Chart no 5 & 6 purchasing e.g virtual, try in on. So 59.1% says yes and 40.9
As seen in chart no 5 & 6 the data we have collected from the % say no.When it comes to AI-based recommendations,
candidates consists of how much they trust AI-powered more than half of the participants trust AI recommendations
while shopping online, although some are not convinced.
recommendation when shopping online e.g. Amazon,
Moreover, over half of the participants have utilized
Myntra, Flipkart , meesho,ajio, etc. so 63.6 % says yes they
trust on AI and 13.6 says no and 22.7% are not sure. In 6th Augmented Reality (AR) capabilities while shopping,
chart shows that how many candidates have used which shows the increasing use of immersive technologies
Augmented reality(AR) features to try products before in online shopping.
77