
Page 277 - IMDR JOURNAL 2023-24
P. 277
IMDR’s Journal of Management Development & Research 2023-24
on previously published works.
It is possible to confirm all of these associations using a variety of inferential statistics or
approaches. These hypotheses may or may not be accepted depending on the effectiveness of
regression procedures. According to the goals of the study, the following hypothesis was
created for testing:
H0- There is no association between age and customer preference for ready-to-eat food
products.
H1- There is an association between age and customer preference for ready-to-eat food
products.
Limitations of the Study
Some limitations of my study are as follows:
1)The study is confined to Jabalpur city only.
2)Due to the time constraint 87 respondents were selected for the study.
3) Decisions made by respondents while filling out the questionnaire may have been
influenced by their preconceptions, and preferences, as well as respondent fatigue, which
may have affected the study's quality.
Types of Data
The researcher has used structured questionnaire for the collection of primary data for the
collection of responses through the survey method. The nature of the study is quantitative
research. It has been conducted with a methodology and primary data was considered.
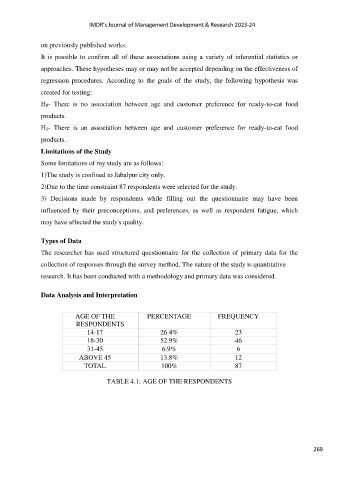
Data Analysis and Interpretation
AGE OF THE PERCENTAGE FREQUENCY
RESPONDENTS
14-17 26.4% 23
18-30 52.9% 46
31-45 6.9% 6
ABOVE 45 13.8% 12
TOTAL 100% 87
TABLE 4.1: AGE OF THE RESPONDENTS
269