Page 278 - IMDR JOURNAL 2023-24
P. 278

IMDR’s Journal of Management Development & Research 2023-24
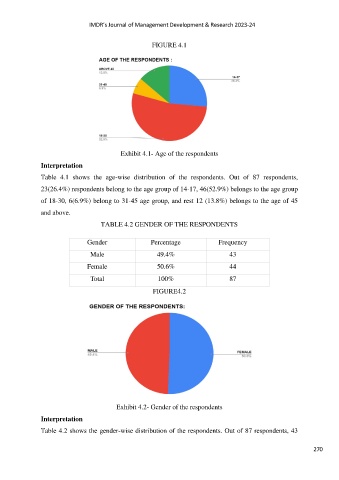

                                                      FIGURE 4.1


                                           Exhibit 4.1- Age of the respondents
               Interpretation

               Table  4.1  shows  the  age-wise  distribution  of  the  respondents.  Out  of  87  respondents,

               23(26.4%) respondents belong to the age group of 14-17, 46(52.9%) belongs to the age group
               of 18-30, 6(6.9%) belong to 31-45 age group, and rest 12 (13.8%) belongs to the age of 45

               and above.
                                    TABLE 4.2 GENDER OF THE RESPONDENTS


                                Gender                Percentage              Frequency

                                 Male                   49.4%                     43

                                Female                  50.6%                     44

                                 Total                  100%                      87

                                                       FIGURE4.2


                                          Exhibit 4.2- Gender of the respondents

               Interpretation

               Table 4.2 shows the gender-wise distribution of the respondents. Out of 87 respondents, 43


                                                                                                               270
   273   274   275   276   277   278   279   280   281   282   283