Page 282 - IMDR JOURNAL 2023-24
P. 282

IMDR’s Journal of Management Development & Research 2023-24


                                                          FIGURE 4.7


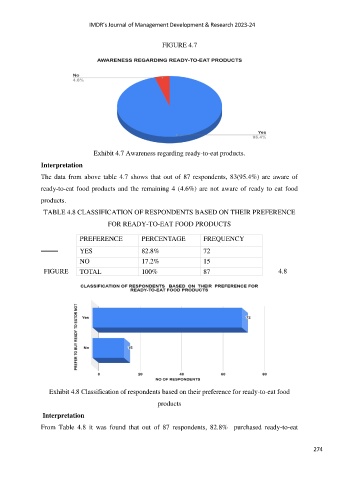
                                  Exhibit 4.7 Awareness regarding ready-to-eat products.
               Interpretation

               The data from  above table 4.7 shows that out  of 87 respondents,  83(95.4%) are  aware of
               ready-to-eat food products and the remaining 4 (4.6%) are not aware of ready to eat food

               products.

                TABLE 4.8 CLASSIFICATION OF RESPONDENTS BASED ON THEIR PREFERENCE
                                       FOR READY-TO-EAT FOOD PRODUCTS

                             PREFERENCE            PERCENTAGE           FREQUENCY


                             YES                   82.8%                72
                             NO                    17.2%                15

                FIGURE       TOTAL                 100%                 87                         4.8


                  Exhibit 4.8 Classification of respondents based on their preference for ready-to-eat food

                                                        products
                Interpretation

               From  Table  4.8  it  was  found  that  out  of  87  respondents,  82.8%    purchased  ready-to-eat


                                                                                                               274
   277   278   279   280   281   282   283   284   285   286   287