
Page 287 - IMDR JOURNAL 2023-24
P. 287
IMDR’s Journal of Management Development & Research 2023-24
Interpretation
The above diagram shows that 92% of consumers feel that quality is an important factor for
purchasing ready-to-eat food products while the rest 8% felt that the quality of ready-to-eat
does not matter.
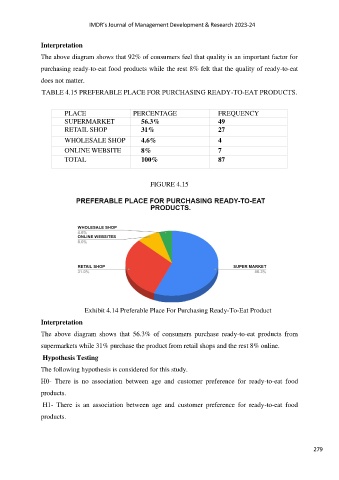
TABLE 4.15 PREFERABLE PLACE FOR PURCHASING READY-TO-EAT PRODUCTS.
PLACE PERCENTAGE FREQUENCY
SUPERMARKET 56.3% 49
RETAIL SHOP 31% 27
WHOLESALE SHOP 4.6% 4
ONLINE WEBSITE 8% 7
TOTAL 100% 87
FIGURE 4.15
Exhibit 4.14 Preferable Place For Purchasing Ready-To-Eat Product
Interpretation
The above diagram shows that 56.3% of consumers purchase ready-to-eat products from
supermarkets while 31% purchase the product from retail shops and the rest 8% online.
Hypothesis Testing
The following hypothesis is considered for this study.
H0- There is no association between age and customer preference for ready-to-eat food
products.
H1- There is an association between age and customer preference for ready-to-eat food
products.
279