
Page 288 - IMDR JOURNAL 2023-24
P. 288
IMDR’s Journal of Management Development & Research 2023-24
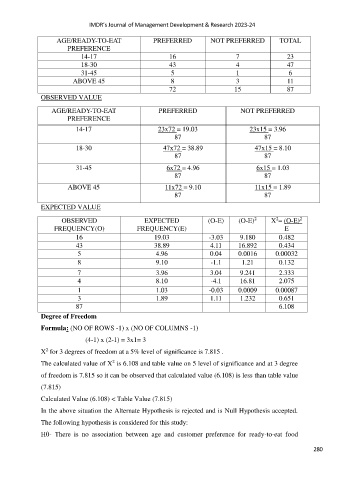
AGE/READY-TO-EAT PREFERRED NOT PREFERRED TOTAL
PREFERENCE
14-17 16 7 23
18-30 43 4 47
31-45 5 1 6
ABOVE 45 8 3 11
72 15 87
OBSERVED VALUE
AGE/READY-TO-EAT PREFERRED NOT PREFERRED
PREFERENCE
14-17 23x72 = 19.03 23x15 = 3.96
87 87
18-30 47x72 = 38.89 47x15 = 8.10
87 87
31-45 6x72 = 4.96 6x15 = 1.03
87 87
ABOVE 45 11x72 = 9.10 11x15 = 1.89
87 87
EXPECTED VALUE
2
2
OBSERVED EXPECTED (O-E) (O-E) X = (O-E) 2
FREQUENCY(O) FREQUENCY(E) E
16 19.03 -3.03 9.180 0.482
43 38.89 4.11 16.892 0.434
5 4.96 0.04 0.0016 0.00032
8 9.10 -1.1 1.21 0.132
7 3.96 3.04 9.241 2.333
4 8.10 -4.1 16.81 2.075
1 1.03 -0.03 0.0009 0.00087
3 1.89 1.11 1.232 0.651
87 6.108
Degree of Freedom
Formula: (NO OF ROWS -1) x (NO OF COLUMNS -1)
(4-1) x (2-1) = 3x1= 3
2
X for 3 degrees of freedom at a 5% level of significance is 7.815 .
2
The calculated value of X is 6.108 and table value on 5 level of significance and at 3 degree
of freedom is 7.815 so it can be observed that calculated value (6.108) is less than table value
(7.815)
Calculated Value (6.108) < Table Value (7.815)
In the above situation the Alternate Hypothesis is rejected and is Null Hypothesis accepted.
The following hypothesis is considered for this study:
H0- There is no association between age and customer preference for ready-to-eat food
280