
Page 283 - IMDR JOURNAL 2023-24
P. 283
IMDR’s Journal of Management Development & Research 2023-24
products, rest 17.2% did not purchase it.
TABLE 4.9 FREQUENCY OF BUYING READY-TO-EAT FOOD PRODUCTS.
Time duration Percentage Frequency
Once in a month 21.3% 17
Twice in a month 21.3% 17
Daily 6.3% 5
Sometimes 51.2% 41
Total 100% 80
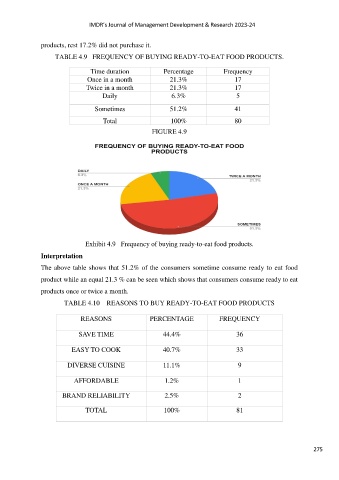
FIGURE 4.9
Exhibit 4.9 Frequency of buying ready-to-eat food products.
Interpretation
The above table shows that 51.2% of the consumers sometime consume ready to eat food
product while an equal 21.3 % can be seen which shows that consumers consume ready to eat
products once or twice a month.
TABLE 4.10 REASONS TO BUY READY-TO-EAT FOOD PRODUCTS
REASONS PERCENTAGE FREQUENCY
SAVE TIME 44.4% 36
EASY TO COOK 40.7% 33
DIVERSE CUISINE 11.1% 9
AFFORDABLE 1.2% 1
BRAND RELIABILITY 2.5% 2
TOTAL 100% 81
275