
Page 312 - IMDR JOURNAL 2023-24
P. 312
IMDR’s Journal of Management Development & Research 2023-24
and blockchain-based financial solutions. This convergence is reshaping the financial
industry landscape, promoting greater convenience, flexibility, and inclusivity in accessing
and managing financial services.
4. Disruption caused by FinTech and impact of digital payments on consumer expenses.
Source: Primary data collected through questionnaire
Table 2.1: Age of the Respondents
Ages of the
respondents Percentage Frequency
Below 18 1.7% 2
18 - 25 35.1% 41
25 - 40 20.5% 24
Above 40 42.7% 50
Total 100% 117
The researcher had circulated the questionnaire through online sources and in response to
this, researcher was able to collect 117 responses. This study in covering respondents only
from Pune city of India. Table 2.1 shows the age-wise distribution of the respondents. Out of
117 respondents, 2(1.7%) respondents belong to the age group of below 18, 41(35.1%)
belongs to the age group of 18-40, 24(20.5%) belong to 25-40 age group, and rest 50 (42.7%)
belongs to the age of 40 and above.
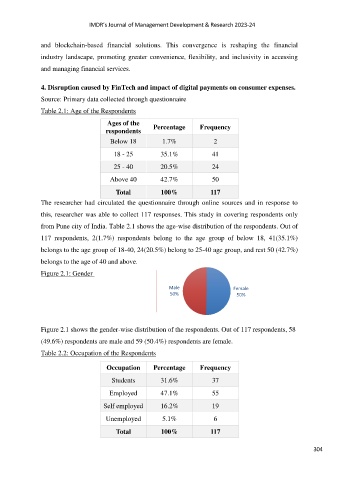
Figure 2.1: Gender
Male Female
50% 50%
Figure 2.1 shows the gender-wise distribution of the respondents. Out of 117 respondents, 58
(49.6%) respondents are male and 59 (50.4%) respondents are female.
Table 2.2: Occupation of the Respondents
Occupation Percentage Frequency
Students 31.6% 37
Employed 47.1% 55
Self employed 16.2% 19
Unemployed 5.1% 6
Total 100% 117
304