
Page 241 - IMDR JOURNAL 2023-24
P. 241
IMDR’s Journal of Management Development & Research 2023-24
2
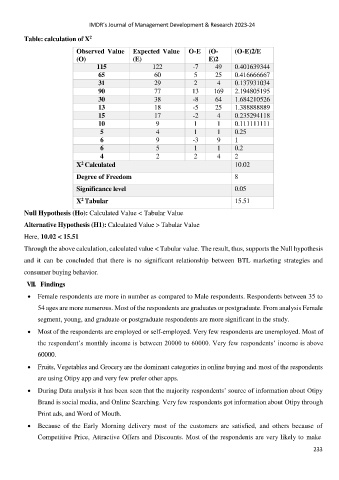
Table: calculation of X
Observed Value Expected Value O-E (O- (O-E)2/E
(O) (E) E)2
115 122 -7 49 0.401639344
65 60 5 25 0.416666667
31 29 2 4 0.137931034
90 77 13 169 2.194805195
30 38 -8 64 1.684210526
13 18 -5 25 1.388888889
15 17 -2 4 0.235294118
10 9 1 1 0.111111111
5 4 1 1 0.25
6 9 -3 9 1
6 5 1 1 0.2
4 2 2 4 2
X Calculated 10.02
2
Degree of Freedom 8
Significance level 0.05
2
X Tabular 15.51
Null Hypothesis (Ho): Calculated Value < Tabular Value
Alternative Hypothesis (H1): Calculated Value > Tabular Value
Here, 10.02 < 15.51
Through the above calculation, calculated value < Tabular value. The result, thus, supports the Null hypothesis
and it can be concluded that there is no significant relationship between BTL marketing strategies and
consumer buying behavior.
VII. Findings
Female respondents are more in number as compared to Male respondents. Respondents between 35 to
54 ages are more numerous. Most of the respondents are graduates or postgraduate. From analysis Female
segment, young, and graduate or postgraduate respondents are more significant in the study.
Most of the respondents are employed or self-employed. Very few respondents are unemployed. Most of
the respondent’s monthly income is between 20000 to 60000. Very few respondents’ income is above
60000.
Fruits, Vegetables and Grocery are the dominant categories in online buying and most of the respondents
are using Otipy app and very few prefer other apps.
During Data analysis it has been seen that the majority respondents’ source of information about Otipy
Brand is social media, and Online Searching. Very few respondents got information about Otipy through
Print ads, and Word of Mouth.
Because of the Early Morning delivery most of the customers are satisfied, and others because of
Competitive Price, Attractive Offers and Discounts. Most of the respondents are very likely to make
233