
Page 335 - IMDR JOURNAL 2023-24
P. 335
IMDR’s Journal of Management Development & Research 2023-24
This formula helps in understanding the magnitude of price movements relative to the
opening price.
Data Analysis:
Comparison of Indices: Both indices' data were compared on the same ground to
facilitate a comprehensive analysis.
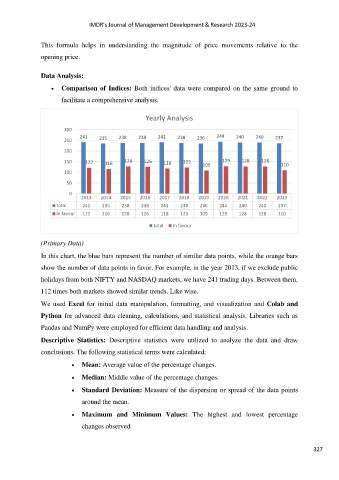
Yearly Analysis
300
241 235 238 238 241 238 236 244 240 240 237
250
200
150 122 116 128 126 118 123 109 129 128 128 110
100
50
0
2013 2014 2015 2016 2017 2018 2019 2020 2021 2022 2023
total 241 235 238 238 241 238 236 244 240 240 237
In favour 122 116 128 126 118 123 109 129 128 128 110
total In favour
(Primary Data)
In this chart, the blue bars represent the number of similar data points, while the orange bars
show the number of data points in favor. For example, in the year 2013, if we exclude public
holidays from both NIFTY and NASDAQ markets, we have 241 trading days. Between them,
112 times both markets showed similar trends. Like wise.
We used Excel for initial data manipulation, formatting, and visualization and Colab and
Python for advanced data cleaning, calculations, and statistical analysis. Libraries such as
Pandas and NumPy were employed for efficient data handling and analysis.
Descriptive Statistics: Descriptive statistics were utilized to analyze the data and draw
conclusions. The following statistical terms were calculated:
Mean: Average value of the percentage changes.
Median: Middle value of the percentage changes.
Standard Deviation: Measure of the dispersion or spread of the data points
around the mean.
Maximum and Minimum Values: The highest and lowest percentage
changes observed.
327