
Page 338 - IMDR JOURNAL 2023-24
P. 338
IMDR’s Journal of Management Development & Research 2023-24
sourced from the official Nasdaq website, ensuring accuracy and consistency in the dataset.
Data Cleaning and Preparation: Upon gathering the data, a meticulous cleaning process
was employed to ensure data accuracy and integrity. This involved removing outliers,
correcting errors, and addressing missing values. Subsequently, the daily closing prices were
utilized to calculate the percentage changes in the opening and closing values for both
indices.
Tools Utilized: A combination of tools was employed for data analysis, including Excel and
Python. Excel was utilized for initial data manipulation, descriptive statistics calculations,
and data visualization. Python, with its powerful libraries such as Pandas and NumPy,
facilitated advanced statistical analysis, correlation calculations, and robustness checks.
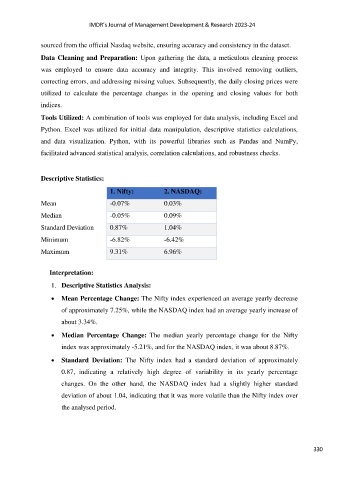
Descriptive Statistics:
1. Nifty: 2. NASDAQ:
Mean -0.07% 0.03%
Median -0.05% 0.09%
Standard Deviation 0.87% 1.04%
Minimum -6.82% -6.42%
Maximum 9.31% 6.96%
Interpretation:
1. Descriptive Statistics Analysis:
Mean Percentage Change: The Nifty index experienced an average yearly decrease
of approximately 7.25%, while the NASDAQ index had an average yearly increase of
about 3.34%.
Median Percentage Change: The median yearly percentage change for the Nifty
index was approximately -5.21%, and for the NASDAQ index, it was about 8.87%.
Standard Deviation: The Nifty index had a standard deviation of approximately
0.87, indicating a relatively high degree of variability in its yearly percentage
changes. On the other hand, the NASDAQ index had a slightly higher standard
deviation of about 1.04, indicating that it was more volatile than the Nifty index over
the analysed period.
330