
Page 337 - IMDR JOURNAL 2023-24
P. 337
IMDR’s Journal of Management Development & Research 2023-24
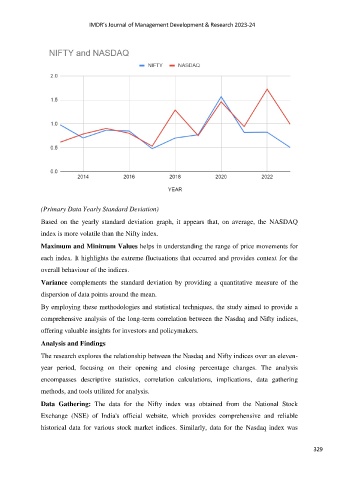
(Primary Data Yearly Standard Deviation)
Based on the yearly standard deviation graph, it appears that, on average, the NASDAQ
index is more volatile than the Nifty index.
Maximum and Minimum Values helps in understanding the range of price movements for
each index. It highlights the extreme fluctuations that occurred and provides context for the
overall behaviour of the indices.
Variance complements the standard deviation by providing a quantitative measure of the
dispersion of data points around the mean.
By employing these methodologies and statistical techniques, the study aimed to provide a
comprehensive analysis of the long-term correlation between the Nasdaq and Nifty indices,
offering valuable insights for investors and policymakers.
Analysis and Findings
The research explores the relationship between the Nasdaq and Nifty indices over an eleven-
year period, focusing on their opening and closing percentage changes. The analysis
encompasses descriptive statistics, correlation calculations, implications, data gathering
methods, and tools utilized for analysis.
Data Gathering: The data for the Nifty index was obtained from the National Stock
Exchange (NSE) of India's official website, which provides comprehensive and reliable
historical data for various stock market indices. Similarly, data for the Nasdaq index was
329