Page 336 - IMDR JOURNAL 2023-24
P. 336

IMDR’s Journal of Management Development & Research 2023-24


                            Variance: Measure of how far each value in the data set is from the mean.

                            Correlation:  Degree  of  relationship  between  the  percentage  changes  of  the
                              two indices.


                   (secondary source mathematical website)


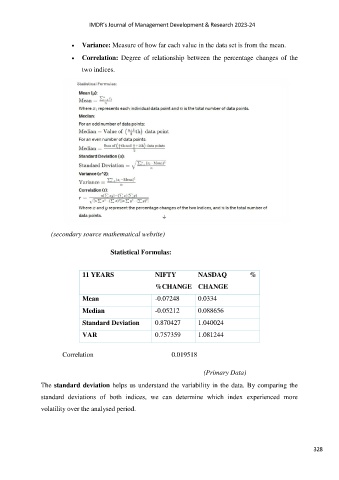
                                        Statistical Formulas:


                              11 YEARS                 NIFTY           NASDAQ            %

                                                       %CHANGE  CHANGE
                              Mean                     -0.07248        0.0334

                              Median                   -0.05212        0.088656

                              Standard Deviation       0.870427        1.040024

                              VAR                      0.757359        1.081244


                       Correlation                           0.019518


                                                                         (Primary Data)

               The standard deviation helps us understand the variability in the data. By comparing the
               standard  deviations  of  both  indices,  we  can  determine  which  index  experienced  more

               volatility over the analysed period.


                                                                                                               328
   331   332   333   334   335   336   337   338   339   340   341