
Page 339 - IMDR JOURNAL 2023-24
P. 339
IMDR’s Journal of Management Development & Research 2023-24
Variance: The variance for the Nifty index was approximately 0.757, and for the NASDAQ
index, it was approximately 1.081. This means that the NASDAQ index had a higher
dispersion of data points around the mean compared to the Nifty index.
The range of percentage changes for both indices is wide, with notable fluctuations in both
directions, indicating periods of both growth and decline.
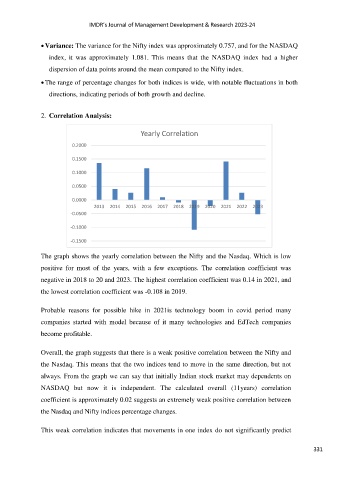
2. Correlation Analysis:
Yearly Correlation
0.2000
0.1500
0.1000
0.0500
0.0000
2013 2014 2015 2016 2017 2018 2019 2020 2021 2022 2023
-0.0500
-0.1000
-0.1500
The graph shows the yearly correlation between the Nifty and the Nasdaq. Which is low
positive for most of the years, with a few exceptions. The correlation coefficient was
negative in 2018 to 20 and 2023. The highest correlation coefficient was 0.14 in 2021, and
the lowest correlation coefficient was -0.108 in 2019.
Probable reasons for possible hike in 2021is technology boom in covid period many
companies started with model because of it many technologies and EdTech companies
become profitable.
Overall, the graph suggests that there is a weak positive correlation between the Nifty and
the Nasdaq. This means that the two indices tend to move in the same direction, but not
always. From the graph we can say that initially Indian stock market may dependents on
NASDAQ but now it is independent. The calculated overall (11years) correlation
coefficient is approximately 0.02 suggests an extremely weak positive correlation between
the Nasdaq and Nifty indices percentage changes.
This weak correlation indicates that movements in one index do not significantly predict
331