
Page 334 - IMDR JOURNAL 2023-24
P. 334
IMDR’s Journal of Management Development & Research 2023-24
In contrast, Sharma and Verma (2019) conducted a long-term analysis over a 11 years period,
employing statistical techniques such as cointegration analysis. Their study identified a
significant long-term correlation between the Nasdaq and Nifty indices. This long-term
perspective allowed them to assess the stability and sustainability of the correlation,
providing insights into portfolio diversification strategies.
Furthermore, Gupta et al. (2020) investigated the impact of global market movements on the
Indian stock market, including those of the Nasdaq index, using event study methodology.
While their focus extended beyond the Nasdaq Nifty correlation, their findings highlighted
the interconnectedness of global markets and emphasized the need to consider external
factors in market analysis.
Overall, these studies collectively offer valuable insights into the correlation between the
Nasdaq index and the Nifty index within the Indian context. They underscore the importance
of both short-term and long-term perspectives in understanding the dynamics of this
relationship, providing valuable implications for investors and policymakers.
Methodology and Data:
Data Collection:
Secondary Data: Historical data spanning eleven years (2013-2023) was collected
from the official websites of the National Stock Exchange (NSE) for the Nifty index
and the NASDAQ for the Nasdaq index.
Daily Open and Closing Prices: Data points for daily open and closing prices were
gathered for both indices.
Data Preparation:
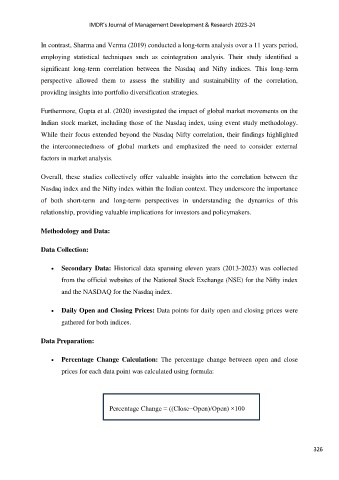
Percentage Change Calculation: The percentage change between open and close
prices for each data point was calculated using formula:
Percentage Change = ((Close−Open)/Open) ×100
326