Page 31 - IMDR JOURNAL 2023-24
P. 31

IMDR’s Journal of Management Development & Research 2023-24

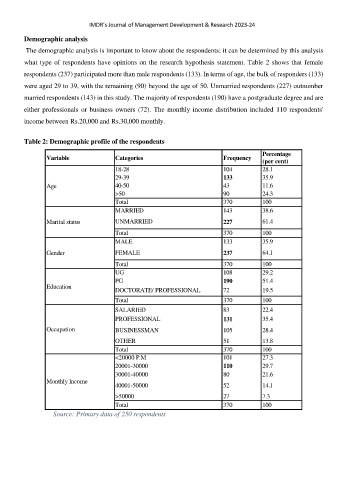
         Demographic analysis
          The demographic analysis is important to know about the respondents; it can be determined by this analysis

         what type of respondents have opinions on the research hypothesis statement. Table 2 shows that female
         respondents (237) participated more than male respondents (133). In terms of age, the bulk of responders (133)

         were aged 29 to 39, with the remaining (90) beyond the age of 50. Unmarried respondents (227) outnumber
         married respondents (143) in this study. The majority of respondents (190) have a postgraduate degree and are

         either  professionals  or  business  owners  (72).  The  monthly  income  distribution  included  110  respondents'

         income between Rs.20,000 and Rs.30,000 monthly.

         Table 2: Demographic profile of the respondents

                                                                                             Percentage
                 Variable                Categories                            Frequency
                                                                                             (per cent)
                                         18-28                                 104           28.1
                                         29-39                                 133           35.9
                 Age                     40-50                                 43            11.6
                                         >50                                   90            24.3
                                         Total                                 370           100
                                         MARRIED                               143           38.6

                 Marital status          UNMARRIED                             227           61.4
                                         Total                                 370           100
                                         MALE                                  133           35.9

                 Gender                  FEMALE                                237           64.1
                                         Total                                 370           100
                                         UG                                    108           29.2
                                         PG                                    190           51.4
                 Education
                                         DOCTORATE/ PROFESSIONAL               72            19.5
                                         Total                                 370           100
                                         SALARIED                              83            22.4
                                         PROFESSIONAL                          131           35.4

                 Occupation              BUSINESSMAN                           105           28.4

                                         OTHER                                 51            13.8
                                         Total                                 370           100
                                         <20000 P.M                            101           27.3
                                         20001-30000                           110           29.7
                                         30001-40000                           80            21.6
                 Monthly Income
                                         40001-50000                           52            14.1
                                         >50000                                27            7.3
                                         Total                                 370           100
                    Source: Primary data of 250 respondents
   26   27   28   29   30   31   32   33   34   35   36