
Page 222 - IMDR JOURNAL 2023-24
P. 222
IMDR’s Journal of Management Development & Research 2023-24
education in India. This secondary data analysis revealed issues around employability, curriculum relevance,
infrastructure, faculty availability, perception and career guidance. Building on these insights, a multi-section
questionnaire containing Likert scales, open-ended questions and demographics was developed and personally
administered by the researcher to 130 vocational students from undergraduate to postgraduate levels in Pune.
Convenience sampling helped access participants across multiple colleges. The students participated
voluntarily in 15-20 minute long face-to-face surveys after giving verbal informed consent and receiving
clarity on objectives and anonymity. Finally, the trends from primary survey data were integrated with
secondary findings to enable an in-depth evaluation of persisting gaps in the vocational ecosystem and
recommendations were made for impactful reforms focusing on identified challenge areas.
Age of the Respondents
The researcher had circulated the questionnaire through online sources and in response to this, researcher was
able to collect 130 responses. Out of 130 respondents, 3(2.3%) respondents belong to the age group of below
18, 107(82.3%) belongs to the age group of 18-24, 19(14.6%) belong to 25-34 age group, there were no
responses from age group 34-44 and rest 1(0.8%) belongs to the age of 45 and above.. Out of 130 respondents,
67 (51.5%) respondents are male and 68 (48.5%) respondents are female.
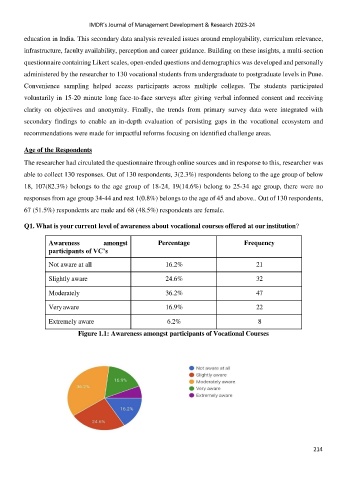
Q1. What is your current level of awareness about vocational courses offered at our institution?
Awareness amongst Percentage Frequency
participants of VC’s
Not aware at all 16.2% 21
Slightly aware 24.6% 32
Moderately 36.2% 47
Very aware 16.9% 22
Extremely aware 6.2% 8
Figure 1.1: Awareness amongst participants of Vocational Courses
214