
Page 368 - IMDR JOURNAL 2023-24
P. 368
IMDR’s Journal of Management Development & Research 2023-24
feature players from particular region.
E] Economic Consideration
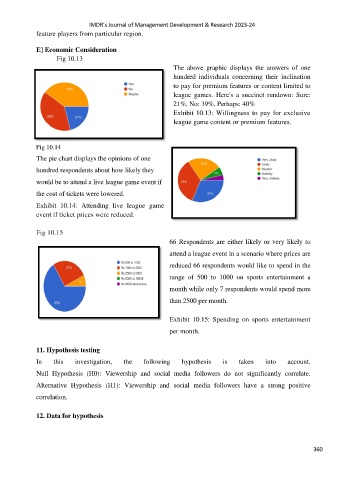
Fig 10.13
The above graphic displays the answers of one
hundred individuals concerning their inclination
to pay for premium features or content limited to
league games. Here's a succinct rundown: Sure:
21%, No: 39%, Perhaps: 40%
Exhibit 10.13: Willingness to pay for exclusive
league game content or premium features.
Fig 10.14
The pie chart displays the opinions of one
hundred respondents about how likely they
would be to attend a live league game event if
the cost of tickets were lowered.
Exhibit 10.14: Attending live league game
event if ticket prices were reduced.
Fig 10.15
66 Respondents are either likely or very likely to
attend a league event in a scenario where prices are
reduced 66 respondents would like to spend in the
range of 500 to 1000 on sports entertainment a
month while only 7 respondents would spend more
than 2500 per month.
Exhibit 10.15: Spending on sports entertainment
per month.
11. Hypothesis testing
In this investigation, the following hypothesis is taken into account.
Null Hypothesis (H0): Viewership and social media followers do not significantly correlate.
Alternative Hypothesis (H1): Viewership and social media followers have a strong positive
correlation.
12. Data for hypothesis
360